How to read reports
1. Overview
Generate the HTML report is easy. Simply run:
vendor/bin/phpmetrics --report-html=/tmp/report.htmlThe HTML report is generated in the /tmp/report.html file.
The report is composed from different parts :
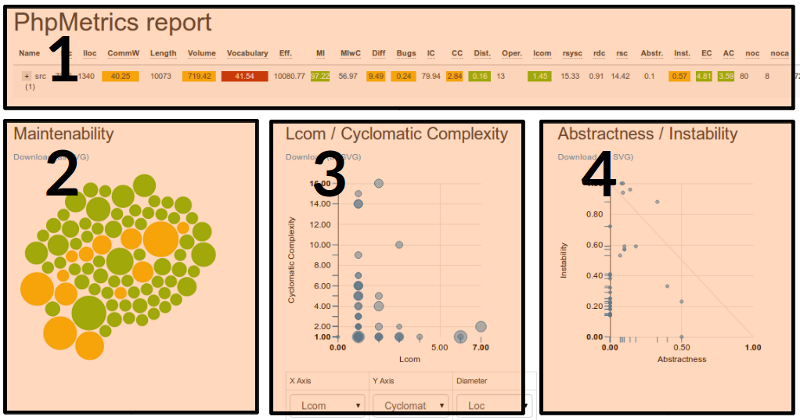
When any information has color, PhpMetrics try to get your attention about significant information:
- Green: all looks correct
- Yellow: correct, but be careful
- Red: anomaly detected
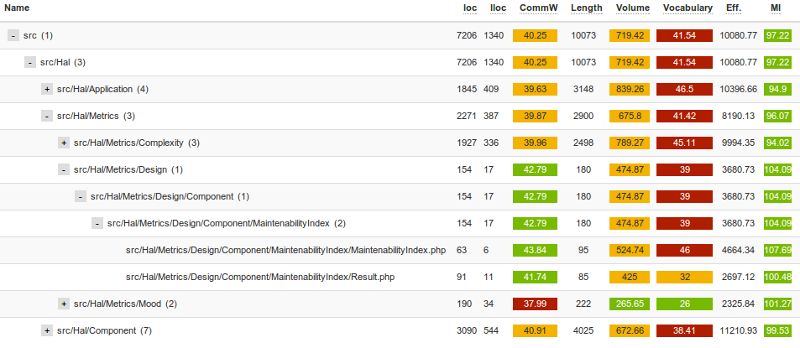
2. The tabular area
This area display main metrics for each package. Do not hesitate to click on the + button (on the left) in order to explore packages and to search specifc class.
You can hover titles of columns to get more description of the metric. Abbrevations are explained in the documentation.
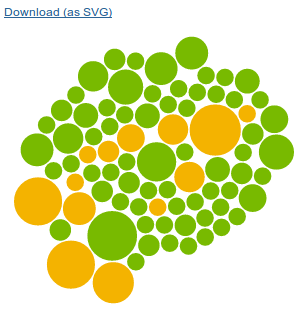
3. The Bubbles area
The bubbles area is the most "visual" part of the report.
- Each file is symbolized by a circle
- Size of the circle represents the Cyclomatic complexity
- Color of the circle represents te Maintainability Index
- Move your cursor on a circle to have details
Large red circles will be probably hard to maintain.
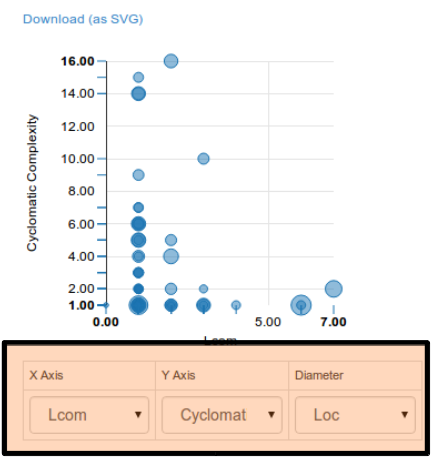
4. The Custom chart area
This area can display all charts you want. You just need to select, at the bottom, the datas you want to be displayed.
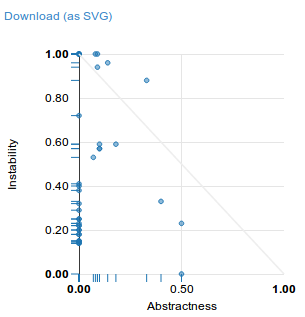
5. The Abstractness / instability area